There are many justifications for taking the time to establish key drivers of product satisfaction. If you know what factors contribute to satisfaction or dissatisfaction, your company can take the appropriate actions with confidence, and realize the following benefits:
- Greater adoption of your product
- More renewals and lower customer churn
- Increased upsell/cross-sell opportunities
- More customers willing to serve as references for sales efforts
- More referrals from most of your loyal advocates
- Positive reviews online on sites like G2 and TrustRadius
- Stronger brand reputation (as measured by Net Promoter Score)
- Higher win rates in competitive deals
We work with a number of software companies, and our clients are measuring and tracking many of these metrics, with some of them used as Key Performance Indicators to assess the overall health of their customer relationships. Whether it’s goals around Net Promoter Score, more 5-star reviews online, increasing revenue from existing customers, or greater usage and adoption across the user base, strength in these metrics is vital for maximizing revenue growth.
How to use Key Product Satisfaction Drivers
So how specifically are companies using their key product satisfaction drivers?
First, they are using this data to make more informed decisions about where to focus their improvement efforts. These are companies that prefer to rely on data and facts to make such important decisions rather than relying on intuition or maybe the loudest voices in their customer base.
Key drivers are also used to optimize products to meet their users' needs better. Understanding precisely why your users are happy or frustrated should inform the product roadmap, and your continuous improvement efforts are likely to enhance your company’s reputation.
Also, satisfaction drivers serve as a blueprint for improving the overall customer experience. This is true not just among your users but also of budget holders and champions who may not use the product day to day.
Companies engaged in these activities are likely to experience lower churn and higher customer lifetime value, both of which lead to accelerated revenue and profit growth.
What is a key driver analysis?
Key Driver Analysis, or KDA, tells you the relative importance of independent variables (drivers) on your dependent or outcome variable. We’re going to discuss what that actually means, but the justification for going through this exercise is that KDA will help your organization focus efforts on areas most likely to move the needle on overall customer satisfaction and loyalty.
There are two widely accepted approaches to understanding key drivers – one is called derived importance, and the other is known as stated importance.
Identifying Your Product Satisfaction Drivers
At a high level, here are the steps to identifying your key drivers of product satisfaction using derived importance.
We’re going to spend a few minutes on each of these steps because there are a number of best practices to consider and pitfalls to watch out for.
But for your Derived importance KDA, you’ll need to design an online survey questionnaire, field the survey, then run your Key Driver Analysis (we use Displayr) using the survey response data, then prepare the reporting to show which attributes or drivers to focus on.
What Questions to Ask in Your Survey?
With plans to run a KDA using your survey data, the questions posed become even more important because we have to include as many attributes as possible (without fatiguing respondents) that are likely to have a meaningful influence on your dependent variable, like overall satisfaction. If we ask questions that aren’t actionable to improving satisfaction, or if we leave important attributes out of our survey, the resulting data won’t be as strong. For the statistically minded, I’m referring to the R-squared which is a goodness-of-fit measure.
So how do you determine the right questions to include in your survey? I recommend you start with the following:
- What have your customers or power users shared in your customer community or user group if you have them?
- If you have any existing surveys, what feedback can you find there?
- What can you see from your support interactions as to what frustrates your users?
- What can you glean from discussions with some of your largest customers or power users?
These are just some examples. There are other places you can look, like if you have a Product Council or from existing reviews of your product online. If your company uses a customer success platform like Gainsight, ChurnZero, or Catalyst, there’s likely a lot of valuable intelligence in there as well, or in your CRM. What you learn from these sources will give you a head start on defining what your customers care about most, and those concepts will serve as the independent variables you’ll want to form questions around for your survey.
When a company first engages Satrix Solutions to design and field a customer satisfaction survey, our discovery phase includes requesting the feedback from all of these sources. We don’t design a survey in a vacuum, and I strongly recommend you don’t either.
In addition to sourcing all this feedback, another challenge is that much of this content will be unstructured, qualitative feedback. Transcripts from customer conversations, notes in your CRM, or technical support emails – it’s all text-based feedback that needs to be analyzed.
Thematic Analysis
Thematic Analysis is a data analysis process that involves methodically identifying patterns in your qualitative feedback, systematically coding, deriving themes, and creating a narrative. Here I’ve shared the steps for converting all that qualitative feedback you’ve collected into prominent themes.
- Review unstructured feedback and observe / note patterns
- Create a set of initial codes
- Decide the codes you will use; add new codes as needed
- Associate codes with specific comments
- Group codes into themes (i.e. feature/functionality, Ease of Use, Reporting)
- Write the final narrative.
There are some tools you can leverage to help, but we feel the best approach is still one that relies largely on humans. The quality of the analysis is better when a person, not a machine, reviews the feedback, identifies codes, creates a code book, and groups those codes into themes.
Dependent Variables
Now that you have your likely drivers, the key driver analysis we’re going to run requires you also identify your dependent variable. Based on our client discovery process and discussions with executives, we often recommend the dependent variable for our clients be one of these.
- “How likely are you to recommend?”
- “How likely are you to continue/renew?”
- “Overall, how satisfied or dissatisfied are you with our company / product?”
collaborate internally, then field your survey
So at this point you’ve aggregated customer feedback, you’ve developed your themes and you have a strong sense of what your drivers and your dependent variable will be. Now it’s time to share that with your leadership team and brainstorm a bit. This collaboration is important as you want to be sure you arrive at some consensus with your head of Product, CMO, head of customer success, support leader, and others. This can often be achieved in a 1 or 2 hour workshop where you share your analysis and as a group hammer out the final questions for your survey.
The questions you and the team decide on should 1) cover all the likely drivers of product or customer satisfaction, and 2) adhere to best practices in survey design – with the right question language, the right scales, the right question order, and so on.
Once you’ve designed your survey, the next step is to send the survey to your contact list. You might consider piloting your survey – first targeting a small subset of your customers to see that what you get back aligns with your thinking and there are no big surprises. When you do launch to the broader customer or user base, it’s vital that you invite the right contacts and take steps to maximize response rates so you get good data.
You can imagine how frustrating it would be to do all this work and then get a 5% response rate to your survey, which would essentially stall your efforts. Maximizing survey participation rates can also be its own webinar but there are a lot of recommendations and strategies you can find on our website.
How to run a Key Driver Analysis with Shapley Value regression
Let’s assume you get a strong response rate and have robust, reliable, representative data. Now it’s time to run your Key Driver Analysis. As with many things in the world of customer research, there are various options as to the statistical approach you can take. Some survey tools use Pearson correlation to identify key drivers. You can also use a simple formula in Excel to help you do that.
But we prefer using Shapley Value regression. Here is why:
- It accounts for the (common) circumstance when drivers are highly correlated with each other, something known as multicollinearity.
- Shapley also calculates the marginal contribution that each factor makes to customer satisfaction or LTR.
- Once you have calculated the Shapley value for each factor, you can rank them in terms of their contribution to customer or product satisfaction.
- The predictor variables/attributes with the highest Shapley values represent the most influential drivers of customer satisfaction. These are the results you’ve done all that hard work for and are the areas your company should prioritize improvement efforts to enhance the overall customer experience.
One of the downsides to using Shapley Value is it involves a series of complex computations, but fortunately, there are tools available, like Displayr, that make it nice and easy. I’ll share more about those in a minute.
Key Driver Quadrant Analysis Example
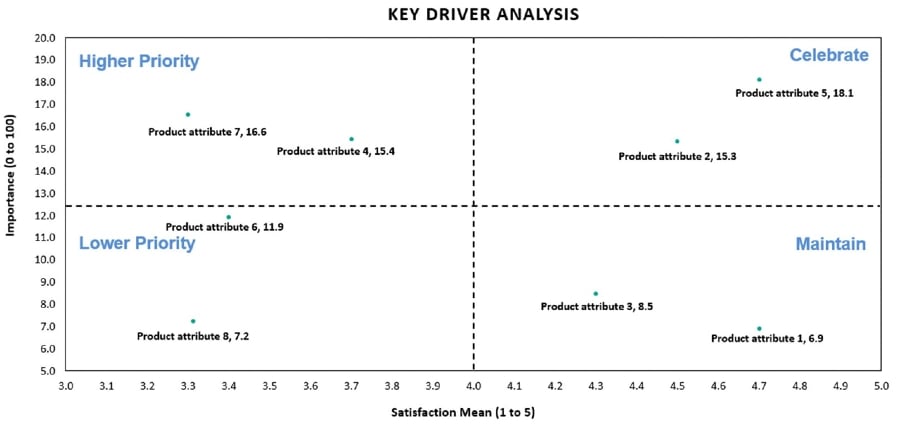
Let’s look at a sample quadrant visual, which is one of the more common ways to show the results of your key driver analysis. What you see here is, if you look at the bottom horizontal line, that satisfaction with the different attributes is plotted along the X-axis. These are the average scores for all the attributes from the survey you fielded. Along the Y-axis to the left, you see the importance scores from our Shapley value regression model, converted or normalized to add up to 100.
The top left quadrant is the attributes that are lower performing but determined to be of high importance. These are the areas most companies focus on first. Based on your KDA, improvements in these areas, like overall satisfaction, should boost your dependent variable.
Across our software clients, we’ve seen various attributes in this top left quadrant, but some of the more common relate to reporting functionality, feature gaps, and sometimes ease of use, among others. You can appreciate that any of these could be significant pain points for users and, over time, could lead to higher churn or negative reviews if not addressed.
In the top right quadrant are drivers identified as important but where the company is performing well in the eyes of its customers. The high levels of satisfaction among these important attributes could serve as competitive advantages that could be emphasized in sales pitches. Many companies continue to improve those attributes in the top right quadrant to maintain their strong performance and further delight customers.
The bottom left is lower priority areas that are less important to customers. They can be fixed, but it’s unlikely that doing so will significantly impact overall satisfaction or loyalty.
Finally, the attributes in the bottom right quadrant are performing well but aren’t as important as those in the upper two quadrants.
So, it was a good bit of work for the one set of data reflected on this quadrant slide, but you can see how the potential impact can be very dramatic. We’ve worked with clients that, over time, continue to push the attributes in the top left quadrant into the top right, and their NPS improved substantially. Equally important is those companies realize the financial benefits of their focus by seeing higher retention levels, more spending from existing accounts, more customers willing to serve as references, and other positive outcomes.
Data Quality Risks
Now, a few cautions. A few prominent risks to conducting key driver analysis include having the wrong attributes in your survey, not including some important attributes, and low response rates that lead to bad data. Here are a few others to watch out for.
- Insufficient response rates
- Poor survey instrument design is clearly a problem. If your survey is not designed well, if you have leading or confusing questions, unbalanced scales, or any of the myriad of problems we see with poor survey design, it significantly jeopardizes the quality of your data.
- If your customer contact list is outdated or doesn’t include the right people, you’re potentially running a KDA using responses from people who may not be as important to your business. As an example, the insights gleaned from this exercise are less meaningful and potentially misleading if your survey population is overweighted with contacts who rarely use the product.
- The risk is similar to sampling bias – let’s say the sample you’ve sent the survey to only includes customers in North America but you get 30% of your revenue overseas. Your KDA could lead you to make decisions that part of your user base would appreciate but may not align with what other customer segments want.
- Confirmation bias comes into play most prominently when you’re analyzing your unstructured feedback and creating that codebook that informs the questions in your survey. It’s important to look at the feedback through an unbiased lens and not conform the data to any preconceived notions the team may have.
- Inadequate follow-up and failure to put insights to use are less associated with your key driver analysis but more for your voice-of-customer program overall. Remember that to identify your key drivers you asked your customers to take the time to complete your survey. It’s imperative that you follow-up with them to address any frustrations they share and also demonstrate clearly that you are using their feedback to make decisions that will improve their experience. Not doing these things runs the risk of upsetting your customers more than if you had never asked for their feedback at all.
I’m sure we’ve all filled out surveys and wondered what was done with our feedback because we never got a response or saw evidence that anything was done with it. That behavior can damage trust, frustrate customers even more, and lower engagement in future surveys, or worse – lead to higher churn.
Closing the loop
You might be surprised to hear that while some companies are good at customer-informed decision-making, they sometimes don’t get enough credit because they don’t communicate it effectively. Your customers will likely experience improvement in your products and service, but it’s also important not to forget to communicate with your customers, circle back and tell them what you’ve done. There are plenty of opportunities to reinforce your commitment to customer experience excellence. Such efforts serve as a real differentiator and competitive advantage, so be sure to highlight it.
Conclusion
Wrapping up, to emphasize some of the important points:
- Carefully review all of the existing customer feedback available to you.
- Use your findings to formulate the right questions for your survey in collaboration with your leadership team.
- Field your survey and maximize response rates to obtain rich, reliable, representative data.
- Run your product satisfaction drivers using Shapley Value, or if you don’t have the requisite tools, you can use Pearson correlation.
- Be sure to leverage the findings from all this hard work to inform important improvement decisions.
- Close the loop with your customers to address frustrations they may have, and tell them what you’ve done.
- Refine and repeat. These efforts – whether you identify drivers using derived importance or stated importance – are not one-and-done endeavors. Many of our clients have win-loss-churn programs running year-round, with deep dive updates quarterly or semi-annually. Online survey programs with key drivers being identified are typically executed twice a year or sometimes annually. This enables you to keep your finger on the pulse of customer sentiment and track changes over time.